


Your cart is currently empty!

Art.nr: Beslutsmodell för skydd av dricksvatten
Decision-making model for the protection of drinking water
0 €
Irregular fracture networks in the rock and the fact that water abstraction from a drilled well can cause a large drawdown of groundwater means that it cannot be guaranteed that a rock drilled well is protected whether it is higher or lower in the ground than a sewerage facility. However, locating the wastewater facility lower in the terrain than the well is a general guiding principle for both dug and rock drilled wells.
However, statistically, rock drilled wells are more protected from contamination than dug wells (the presence of fecal indicator bacteria is more common in dug wells) (SGU Part 1, 20). Based on general estimates of protective distances based on the modeling SGU has done for drilled wells (including a model with a relatively thin soil layer) and trace experiments, the following protective distances are recommended between ground-based facilities and rock-drilled drinking water wells:
- 30-50 m when the borehole cannot be assumed to be located in the direction of flow of the wastewater-affected groundwater
- 50-100 m when the borehole can be assumed to be located in the flow direction of the wastewater-affected groundwater
- Recommended intervals cannot provide any real guarantees but should be seen as an aid to assessment.
Local conditions in the individual case need to be taken into account when assessing the protective distance needed to the rock drilled well. The assessment of the overall risk picture may determine whether to be closer to the maximum or the minimum distance in the recommended safety distance range. Below is a list of factors that influence the risk of contamination of a rock drilled drinking water well and that are appropriate to take into account in the risk assessment. For a more detailed description click on the link to each risk factor.
Risk factors for drilled wells
Level difference between well and sewer during abstraction
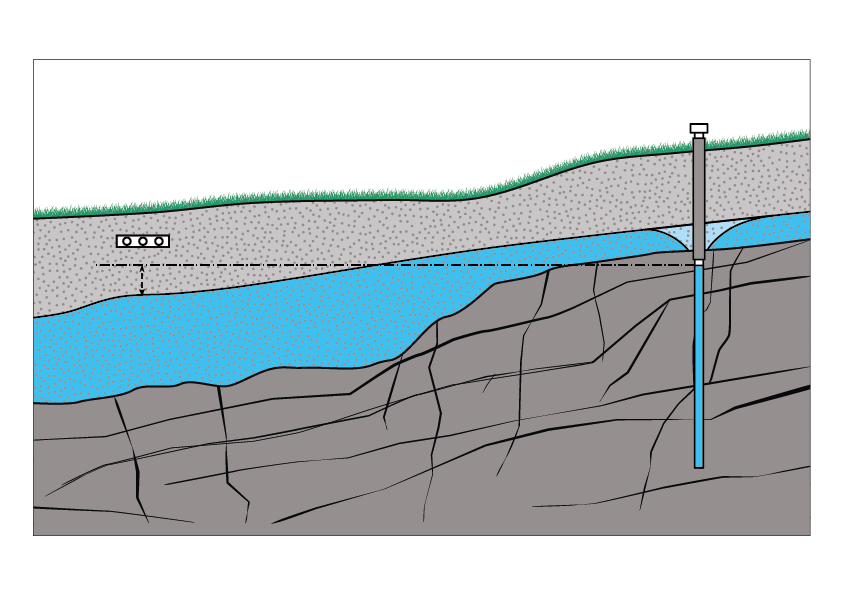
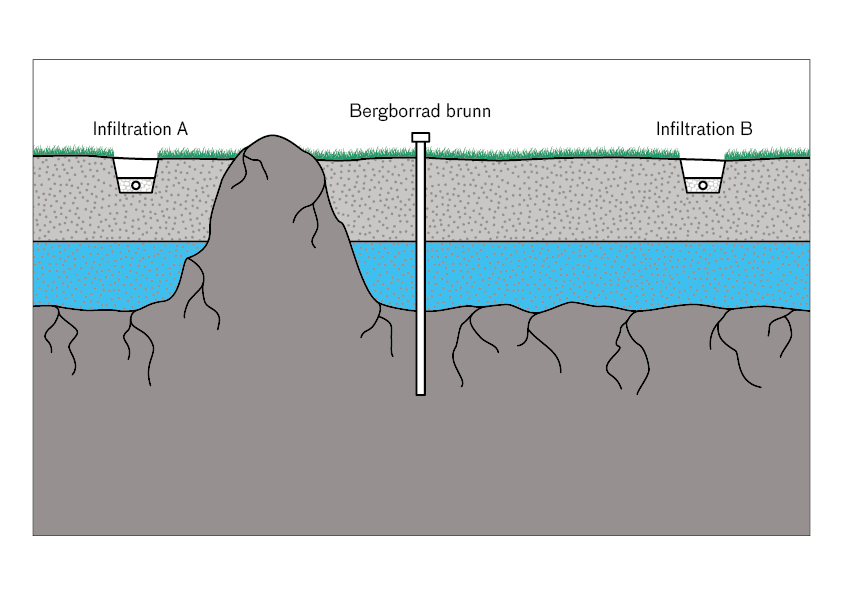
If the groundwater level below the infiltration is lower than the average level in the rock borehole during normal abstraction (Figure 1), there should be no transport from the sewage plant to the rock borehole. However, if the drawdown in the rock borehole is large during normal extraction, there may be a large pressure difference from the infiltration to the rock borehole, which increases the risk of rapid transport and contamination. A period of continuous measurement of the level in the rock borehole (during normal use of the well) is required to get a picture of the average level in the well. Automatic logging equipment can be very helpful.
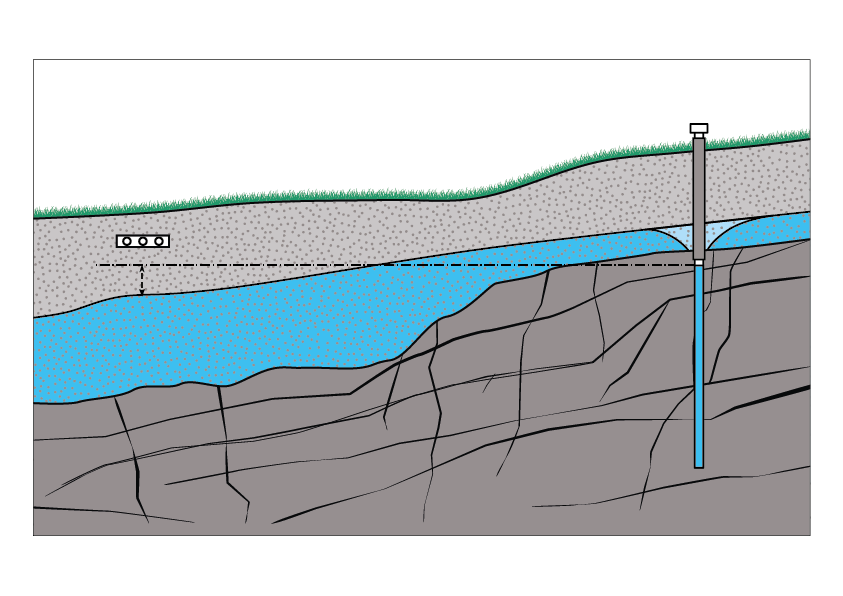
Figure 1: The groundwater level below the infiltration is lower than the average level in the rock borehole during normal extraction, which means that no transport from the sewage plant to the rock borehole should be possible
Hydraulic conductivity of rock
The ability of rock to transmit water is measured as hydraulic conductivity. If the hydraulic conductivity of the rock is low, i.e. the rock’s ability to let water through is low, there is an increased risk of rapid transport in the cracks. This is because the transport volume in the fractures is often smaller than in rock with higher hydraulic conductivity, i.e. more permeable rock.
Thus, for the same amount of water withdrawal from well X located in rock with low hydraulic conductivity compared to well Y located in rock with high hydraulic conductivity, the transport rate will be higher to well X, because the cracks through which the water will be transported to well X are fewer and smaller.
When water is withdrawn from a drilled well, the drawdown will also be greater if the hydraulic conductivity of the rock is lower. This adds up to an increased risk of contamination if the hydraulic conductivity of the rock is low. Hydraulic conductivity can be evaluated from pumping tests in the well or summarized from SGU
Soil depth
The transport of wastewater through the soil layers forms a barrier before groundwater can form. Increasing the soil depth reduces the risk of contamination of a rock drilled well. A useful support is SGU
Permeability (hydraulic conductivity) of soil layers
Denser soils delay transport down to the bedrock surface more than the more permeable soils and therefore provide a better barrier against contamination of a borehole. In order to assess the rate of transport in the soil and thus adequate protection distances, knowledge of the permeability of the soil (hydraulic conductivity) is needed. Samples of the soil material may need to be taken
However, in order to make relevant assessments of permeability in the area concerned, i.e. around the sewage plant and the relevant wells, it is important to consider the hydrogeological conditions at the site as a whole and not uncritically use individual measured values of hydraulic conductivity. For assessment see section Sieve analysis and percolation test.
Groundwater background gradient in the soil layers
The risk of contamination increases the faster and the closer the contaminated groundwater comes to the rock drilled well. The direction and gradient (slope) of the groundwater in the soil layers thus controls the risk in a similar way as for dug wells. For assessment see Determination of groundwater flow direction.
Groundwater availability
If groundwater availability is limited in the immediate area, it increases the risk that the infiltration water is recirculated to the extraction well because there is not much other water available. If groundwater availability is high, the possibility of further dilution of the infiltration water before it eventually reaches the well increases. An assessment of groundwater availability for small aquifers is presented in SGU’s map viewer Groundwater availability in small aquifers.
Tips on how to assess local geological conditions
As discussed above, the risk of contamination is very much determined by local geological features, but these can often be difficult to determine. However, sometimes the local area can provide valuable information that can be used to assess the risk of contamination. Some examples:
A protruding rock slab between the infiltration and the well can be an advantage as it keeps infiltrated wastewater away from the area near the well, which provides increased safety (Figure 2). In the example, there should be a greater risk of contamination in the well from infiltration B than A if the situation is otherwise equivalent. 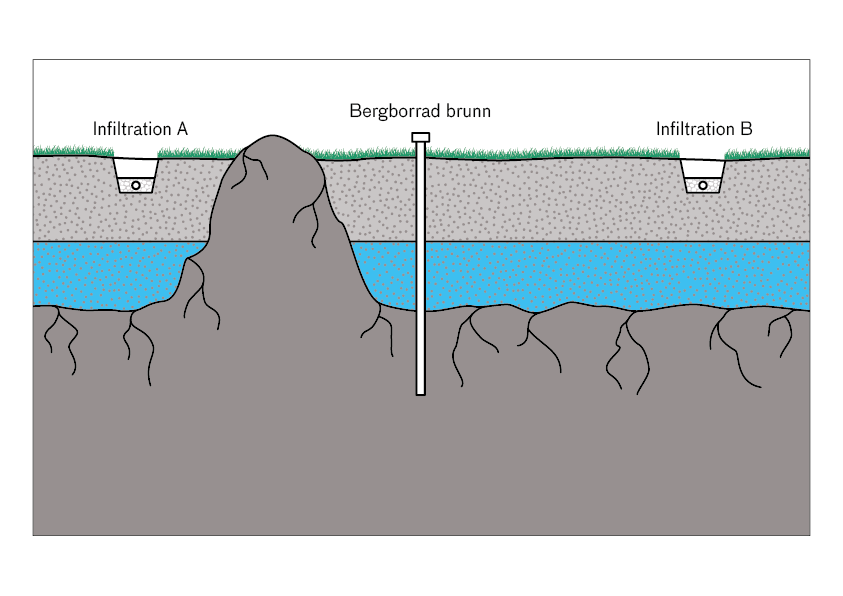
Figure 2. Rising rock between sewerage facility and well reduces risk.
If there are rock outcrops in the area, it may be possible to see if there is a dominant fracture direction and use this in the assessment. In the example in Figure 3, visible fractures are shown as black lines. In this case, there should be a greater risk of contamination in the well from infiltration B than A if the situation is otherwise equivalent. 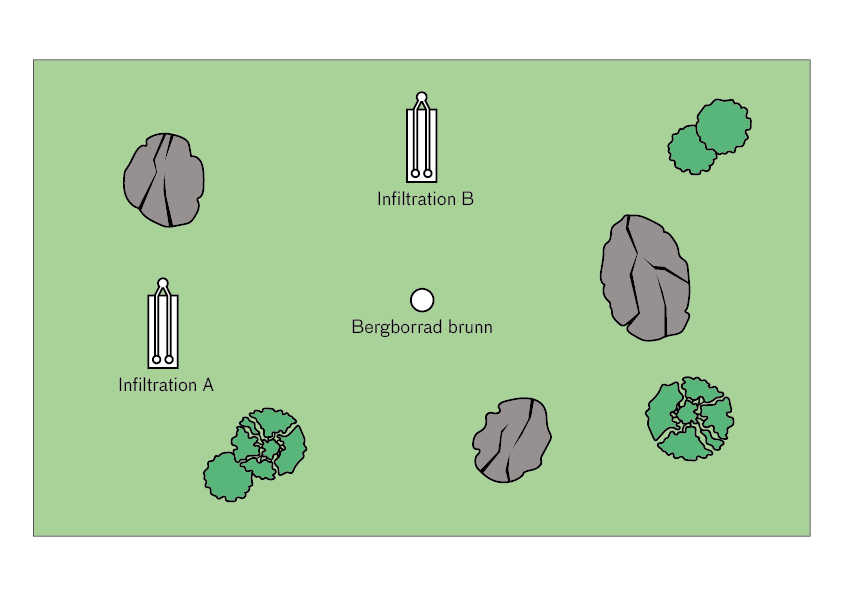
Figure 3: Dominant fracture direction in visible rock outcrops can provide guidance on the placement of drains that poses the least risk of contamination. The risk of contamination in the well from infiltration B is greater than A if the situation is otherwise equivalent.
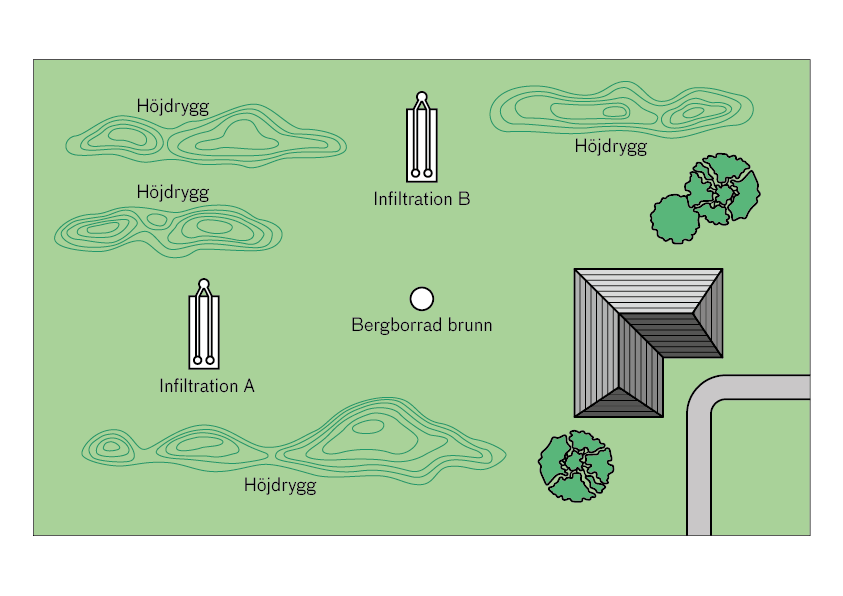
Local ridges and valleys may indicate that there are more or larger rock fractures in a particular direction. Figure 4 shows some ridges that may indicate that the underlying rock has more or larger fractures from left to right (rather than top to bottom). There should then be a greater risk of contamination in the well from infiltration A than B if the situation is otherwise equivalent. 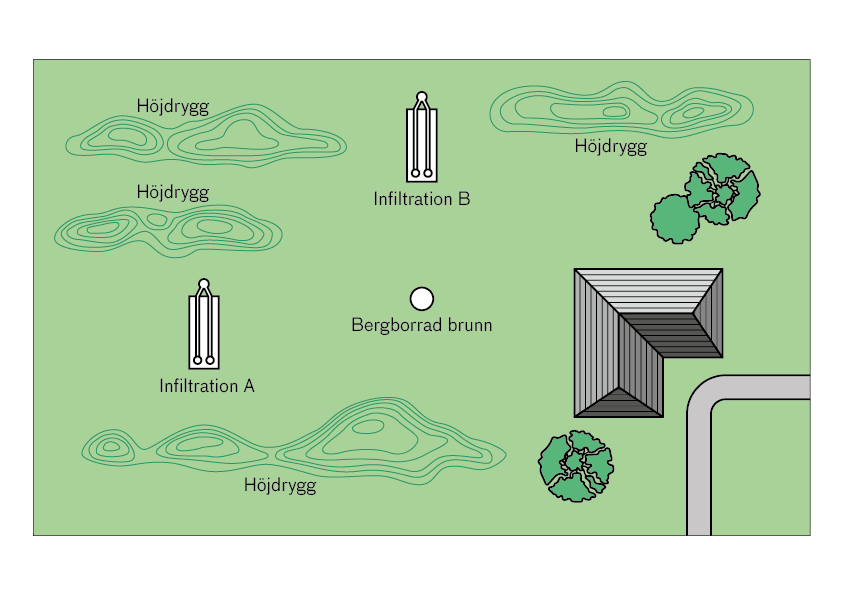
Figure 4. Some guidance on the fractured nature of the rock can be provided by ridges in the immediate area. The ridges indicate a higher probability of larger fractures in the bedrock in the same direction (from left to right, rather than top to bottom). There should then be a greater risk of contamination in the well from infiltration A than B if the situation is otherwise similar.
Examples of safety distance assessment for drilled wells
Figure 5-7 illustrates three examples with gradually deteriorating conditions. A reasonable safety distance assessment for these three cases could be
– 30-40 m for Figure 5, rock drilled well with few risk factors.
– 40-60 m for Figure 6, rock drilled well balancing in a position between high and low risk.
– 80-100 m for Figure 7, rock drilled well with many risk factors.
Figure 5. Rock drilled well with few risk factors. The well is clearly higher in the terrain in relation to the sewer. The level difference between the well and the groundwater beneath the sewer is in the right direction and reassuring. The conductivity of the rock is high (larger fractures and good inflow into the well). Soil depth and groundwater availability are adequate. A reasonable protection distance assessment for this case could be 30-40 m. 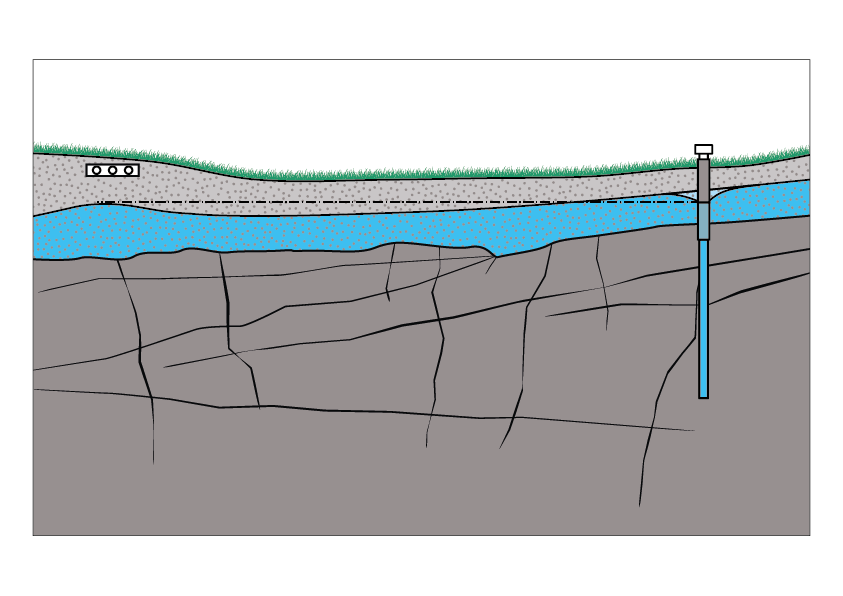
Figure 6. Rock drilled well in a location that balances between high and low risk. The well is not clearly in the flow direction of the wastewater. The difference in level between the well and the groundwater below the sewer is insignificant. The hydraulic conductivity of the rock is somewhere between low and high (greater fracturing and good inflow into the well). There is some soil depth and groundwater availability is neither small nor large. A reasonable protection distance assessment for this case could be 40-60 m.
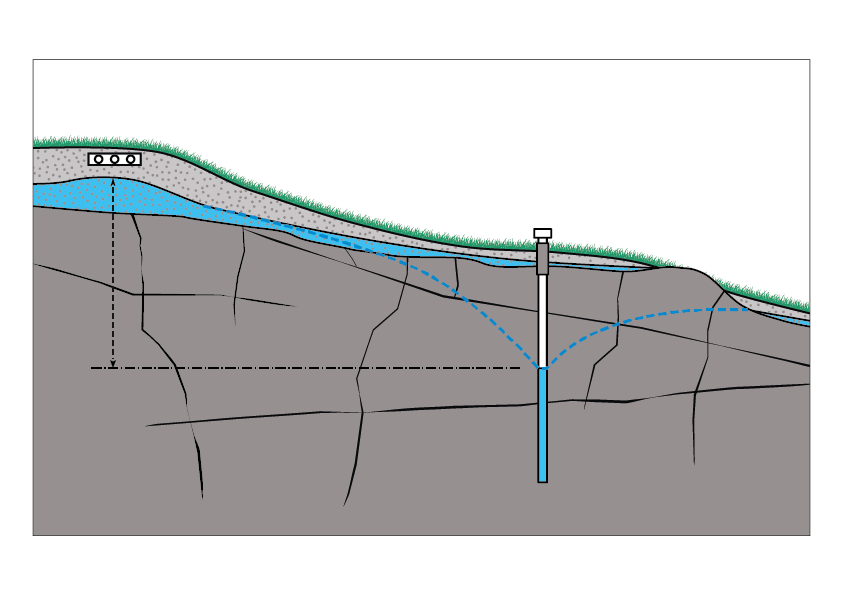
Figure 7. Rock drilled well with many risk factors. The well is located in the direction of wastewater flow, the soil depth is poor, the level differences between the well and the groundwater below the sewage plant are large and the opposite of what is desirable. The conductivity of the rock is low (limited fracturing and poor inflow into the well) and groundwater availability in the soil layers is sparse. A reasonable protection distance assessment for this case could be 80-100 m.
Part B Protective distances to dug wells
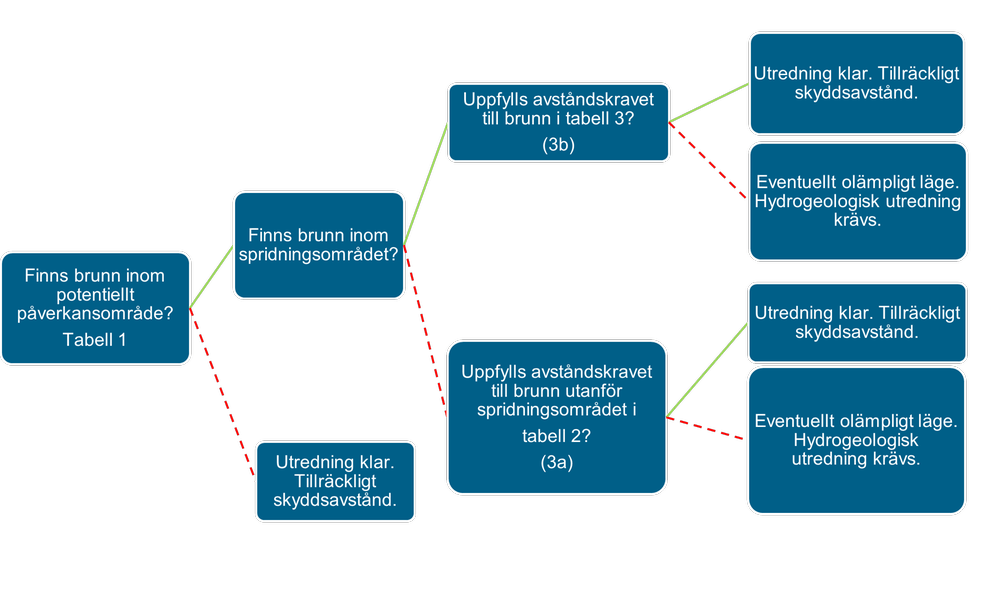
For dug wells, an assessment can be done in steps (Figure 8). First, a general assessment is made of whether there is a risk of impact on the drinking water source based on soil type and distance (impact area). If the drinking water source is located within the area of influence and in the direction of groundwater flow (dispersion area), an assessment of protective distances must be made that carefully ensures that the requirement of 2-3 months transportation time is met.
Even in cases where the drinking water source is located outside the dispersal area, an assessment of protective distances needs to be carried out because there is a risk that a water withdrawal will change the direction of flow so that it goes from the wastewater facility towards the drinking water well (sink funnel). The steps that need to be included in the assessment depend on the location of the wastewater facility in relation to nearby wells (Figure 8).
Step 1 -> Step 2-> Step 3 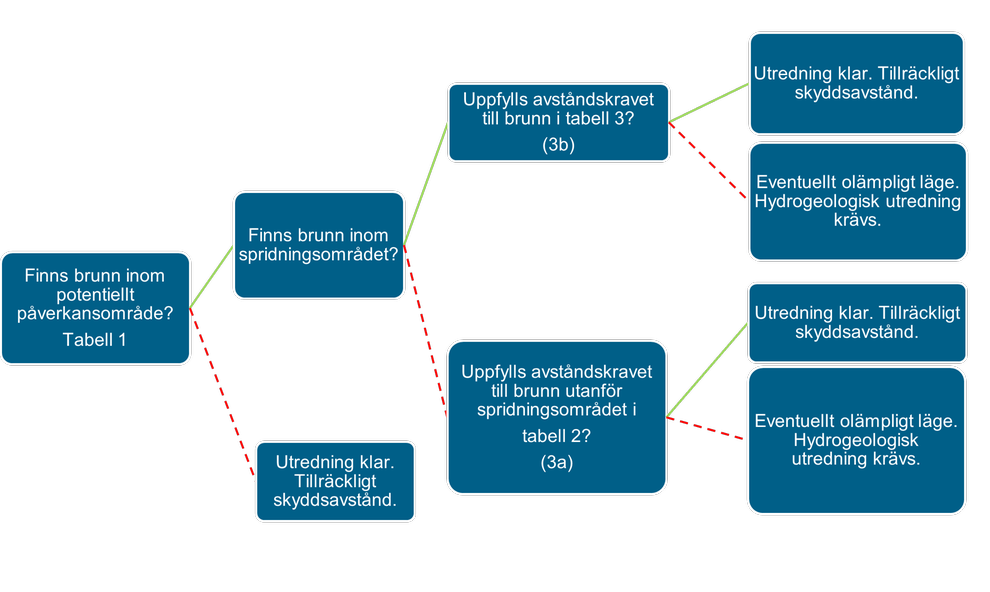
Figure 8. Overview of decision model for dug well protection. Red, dashed line = no. Green line = yes. The image should be read from left to right.
Step 1: Are there drinking water wells within the potential impact area?
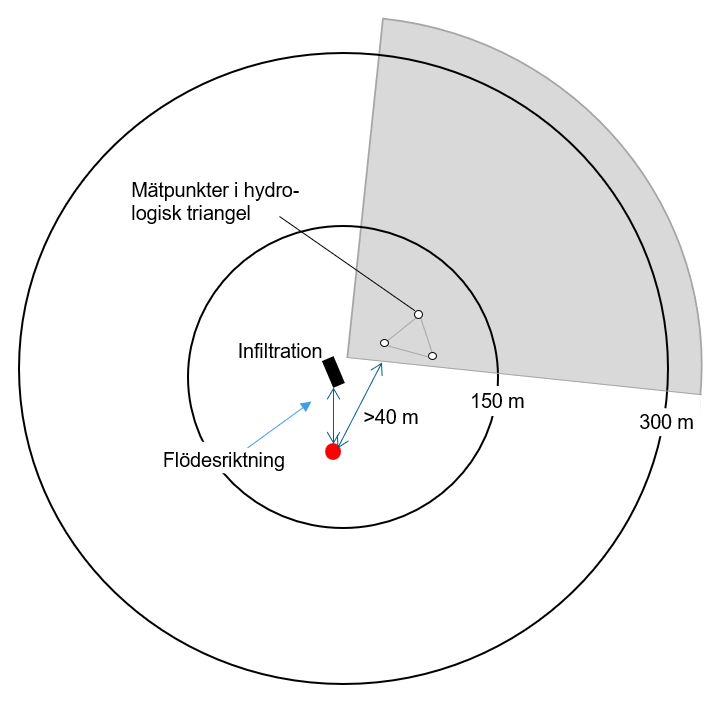
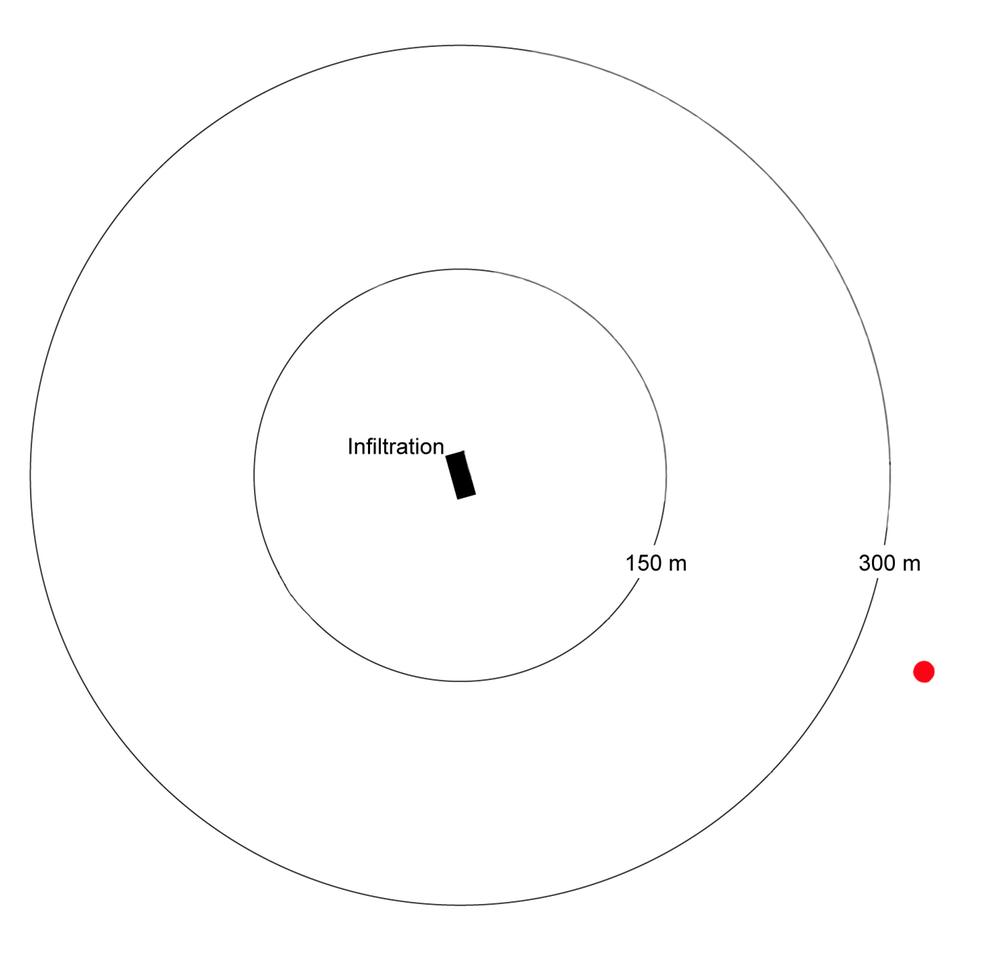
It can normally be considered that there is no risk of impact on wells with drinking water abstraction for one or a few households if there are no wells within 150 meters of the effluent discharge in sand, till or fine-grained soils and within 300 meters in gravel deposits, see Table 1.
Table 4: Guideline values for the potential impact area from infiltration sewage facilities. Values are mainly based on Blaschke et al (Blaschke, et al., 2016) 
Normal case does not include areas with very thin soil layers. Potential impact area is mainly based on Blaschke, et al., (2016).
If the discharge occurs in highly conductive gravel (k-value > 4 x 10⁻⁴ m/s), it is not possible to estimate a reasonable potential impact distance from the wastewater facility as long as it is within the same groundwater body. However, it is uncommon for gravel with such properties to be widespread (Blaschke, et al., 2016).
%20Brunn%20utanf%C3%B6r%20potentiellt%20p%C3%A5verkansomr%C3%A5de.png)
Figure 9. Well (red dot) outside the potential impact area requires only step 1, as long as the soil type consists of gravel deposits, sand, till and similar with a hydraulic conductivity lower than 4 x 10⁻⁴ m/s. See also Table 1.
If the distance to the drinking water source is further than the guidance value for the potential impact area, see Table 1 and Figure 9, no further investigation of the risk of impact on the well is required. If there are wells closer to the site than the proposed guidance values, it is important to be able to reliably assess the direction of groundwater flow, see step 2.
Step 2: Is there a well within the dispersal area?
Step 2 aims to determine whether the drinking water well is located within the dispersion zone (gray zone, Figure 10), i.e. in the natural flow direction of the groundwater. Determining the flow direction may sometimes require hydrogeological field measurements, see section Assessment of the natural groundwater flow direction and background gradient.
The size (angle) of the dispersion area can vary depending, among other things, on the slope of the water table. A large slope results in a smaller dispersion area than a small slope. An assessment must be made in each individual case.
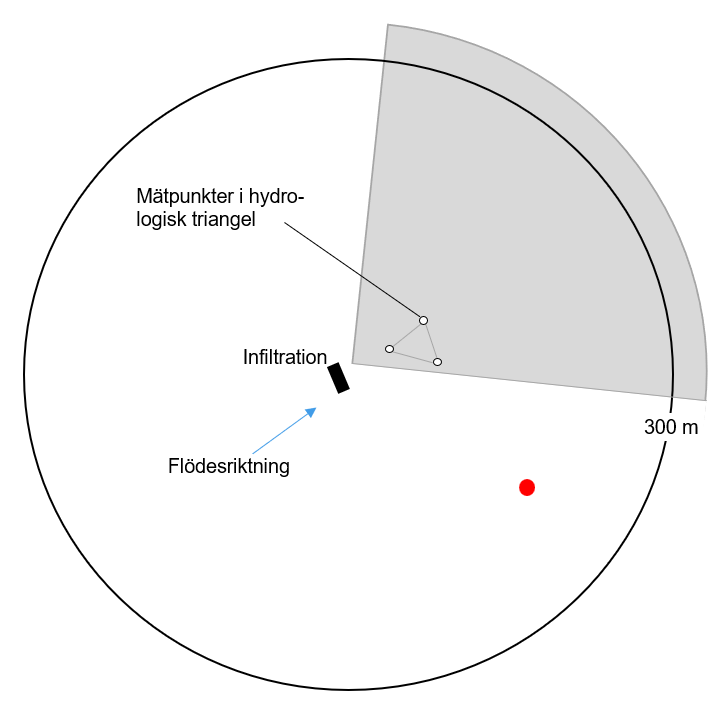
Figure 10. The figure shows an example of a well (red dot) that is found after investigations to be outside the dispersion area (gray zone) even though it is within the potential impact area of Step 1 (in this example within 300 m in gravel with hydraulic conductivity lower than 4 x 10⁻⁴ m/s). The location requires a Step 3a assessment. 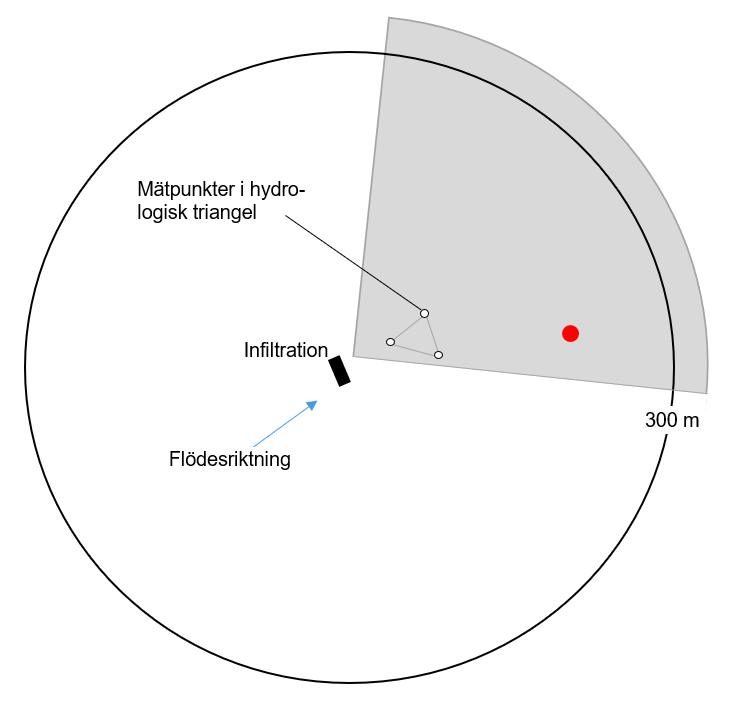
Figure 11. The figure shows an example of a well (red dot) that, after investigations, is found to be within both the dispersal area (gray zone) and the potential impact area (in this example, within 300 m in gravel with hydraulic conductivity lower than 4 x 10⁻⁴ m/s). The location requires a Step 3(b) assessment.
If the drinking water well is located outside the dispersion area, see Figure 10, an assessment of the protective distance still needs to be made. The purpose of the assessment is to rule out the risk of impact due to a change in the direction of groundwater flow during water abstraction, known as a sink funnel, see step 3a.
If the drinking water well is found to be within the dispersion area, see Figure 11, an assessment needs to be made of whether the transport time of the wastewater-impacted groundwater to the drinking water well is at least 2-3 months. The transport time is affected by the current soil and groundwater conditions, see step 3b.
Assessment of natural groundwater flow direction and background gradient
Usually, flow direction is roughly assessed based on the topography of the site combined with rock mapping (review of visible rock features). Rock outcrops can generally be considered as watersheds that direct the water flow in some direction.
Especially in permeable soils, it may be necessary to assume that the well is within the dispersal zone (gray zone) and proceed to assess whether 2-3 months transport time can be guaranteed, step 3b. Examples of areas with difficult to assess flow direction are flat terrain or areas with coarse textured soils (especially pebble ridges) where a flow direction that follows the topography cannot be expected.
In groundwater bodies mapped by SGU, it is common that the flow direction has already been determined. The information is available in SGU’s map services (map viewer Groundwater bodies) and/or in the in-depth descriptions that can be downloaded or ordered through Geolagret. However, it is important to check the applicability of the information to the individual case. SGU’s groundwater mapping has been carried out at several different scales over the years. The methods for determining flow direction vary between these scales.
Where there is uncertainty about the direction of groundwater flow, hydrogeological field measurements may be required. The applicant, or an expert engaged by the applicant, may make field measurements of flow directions by balancing levels. The measurement is made by establishing a so-called hydrological triangle, see Determination of groundwater flow direction. At the same time, it is possible to determine the slope (gradient) of the groundwater surface, which can also affect the risk of a drinking water well.
If no hydrogeological field measurements are carried out, moist areas, level measurements in nearby wells, groundwater discharge in trenches, etc. can provide general support for assessing the position of the groundwater surface and thus also provide a basis for estimating the gradient.
Documentation in the application
The documentation of how the assessment of the groundwater flow direction has taken place should be attached to the application. The case officer assesses whether the documentation is sufficient to form the basis for processing the application.
Step 3: Are distance requirements to wells met?
Step 3 aims to determine whether the proposed location of the wastewater facility is safe in relation to a dug drinking water well. There are two options, a and b, depending on the location of the drinking water well:
3a When the drinking water well is outside the dispersion area (outside the gray zone)
This is a protective distance due to the risk of water abstraction changing the direction of flow from the sewage treatment plant towards the drinking water well (sink funnel). The protective distance refers to the distance to the facility as well as the distance to the dispersal area (gray zone). See figure 10.
3b When the drinking water well is within the dispersal area (inside the gray zone)
Here it is a question of ensuring that the protective distance from the wastewater discharge to the drinking water well is sufficient. See figure 11.
3a When the drinking water well is outside the dispersion area (outside the gray zone)
If the drinking water source is within the impact area but outside the dispersion area, the risk of a water withdrawal changing the direction of flow so that it goes from the sewage plant towards the drinking water well (sink funnel) needs to be investigated, see Figure 12.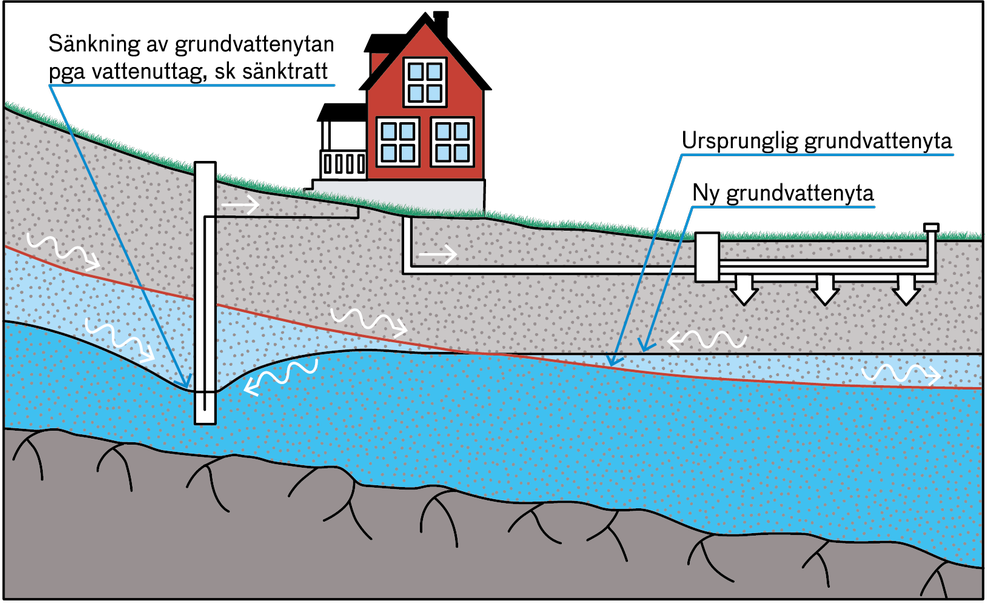
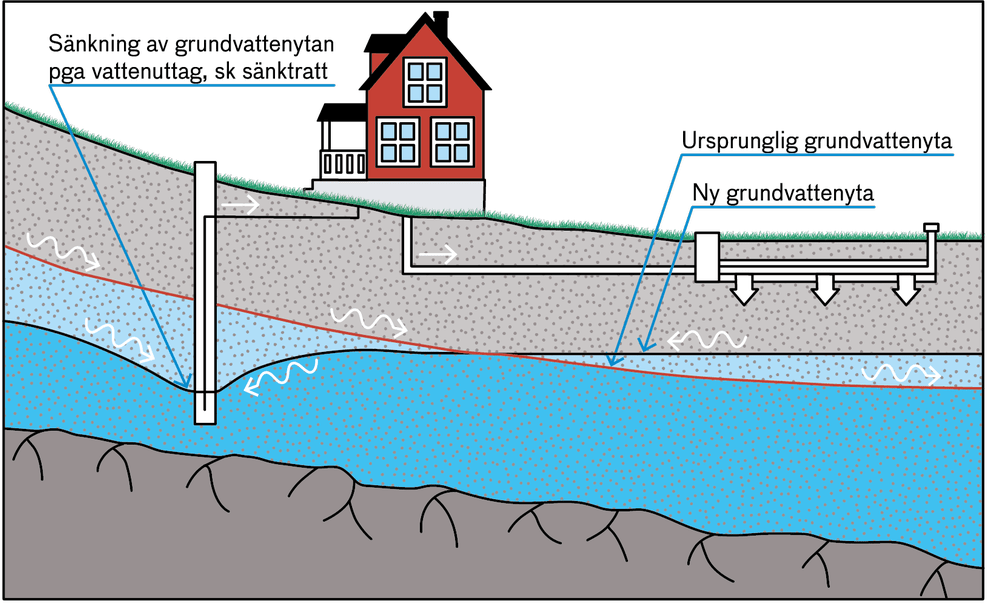
Figure 12. Water abstraction and sewerage facilities can change the direction of groundwater flow. The illustration shows how withdrawing water from a well and adding water from infiltration can change the direction of groundwater flow.
In this case, guidelines for minimum protection distances are given in Table 2. The protection distance applies to the distance to the installation as well as the distance to the dispersal area of the installation (gray zone).
To assess protective distances, knowledge of the permeability of the soil between the well and the discharge point of the wastewater facility and the groundwater gradient is needed, see Determination of hydraulic conductivity. A protective distance of 40 m is generally sufficient regardless of the soil, provided that this distance is maintained to both the well and the discharge point, see Figure 13. However, this does not apply to drinking water wells in permeable soil and flat terrain, see section below. 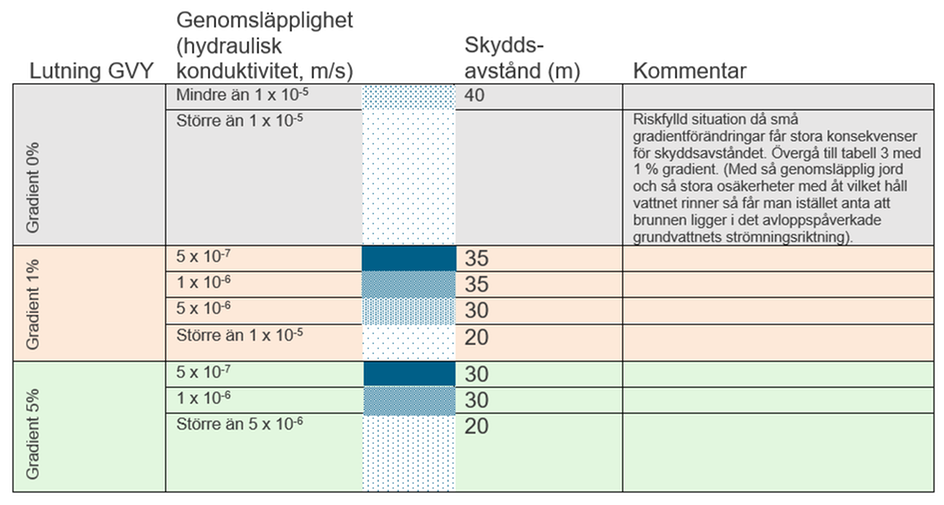
Table 2: Guidelines for minimum protection distances (m) to dug wells when the well is considered to be outside the defined dispersal area (gray zone) of the wastewater facility but within the potential impact area. The protection distance applies to the distance to the plant as well as the distance to the plant’s dispersion area (gray zone). The table is based on the natural slope of the groundwater surface (background gradient) in combination with the permeability of the aquifer. Note that denser soils require larger protection distances. The grid in the third column from the left illustrates soil permeability.

Figure 13. Well (red dot) is outside the dispersal area (gray zone) and more than 40 m from both the sewerage facility and the dispersal area. In this situation, a protective distance of 40 m is generally sufficient regardless of the soil, provided that this distance is maintained to both the well and the dispersal area, with the exception of drinking water wells in permeable soil and flat terrain, see Table 2.
Less permeable soil means longer protection distances
Table 2 shows that a low permeability (low hydraulic conductivity) results in longer protection distances than if the soil is more permeable. If the permeability is low, there is an increased risk of impact on the well. The explanation for this is that groundwater levels in the low conductivity soil are more affected by both water abstraction from the well and water supply at the sewage treatment plant. The low conductivity soil has a low porosity. This forces large changes in the level of the soil when those pores are supplied with water or drained of water. Thus, the risk of reversing the groundwater flow so that the well absorbs wastewater is higher in the low conductive soil than in the high conductive soil.
Drinking water wells in permeable soil and flat terrain are a hazardous situation
If the dug well is in permeable material in flat terrain where it is uncertain in which direction the groundwater surface is inclined, the well is in a hazardous situation. Table 2 refers to Table 3 for these situations.
As the gradient can be difficult to determine and can also vary over time, there is a danger in assuming zero gradient in permeable (highly conductive) soils. The well could then be located both inside and outside the dispersion area of the wastewater facility (gray zone). One must then assume the most hazardous situation and assume that it will be able to be located within the dispersion area of the wastewater facility.
3b When the drinking water well is in the dispersal area (inside the gray zone)
If the determined flow direction means that the drinking water well is in the dispersal area of the wastewater facility, it must be carefully ensured that the requirement of 2-3 months transport time is met. This places higher demands on the documentation from the applicant. Reliable information is required regarding
drinking water well design
groundwater surface slope
distribution of soils between well and sewerage facility
soil water permeability (hydraulic conductivity).
As a rule, most of the required information can be obtained by sampling and investigation in test pits.
An assessment of protection distances can be made based on the site-specific information on the slope of the water table and the permeability of the soil in the direction of flow of the effluent, see Determination of hydraulic conductivity and Determination of the slope of the water table. Table 3 can be used to support the assessment. Table 3 shows protective distances for dug wells and has been calculated using a simplified hydraulic calculation model (SGU part 1, 2023).
Table 3: Guidelines for minimum protection distances (m) to dug wells when the well is considered to be within the dispersion area of the wastewater facility. The table is based on the slope of the groundwater surface (background gradient) in combination with the permeability of the aquifer. The grid in the third column from the left illustrates the permeability of the soil. 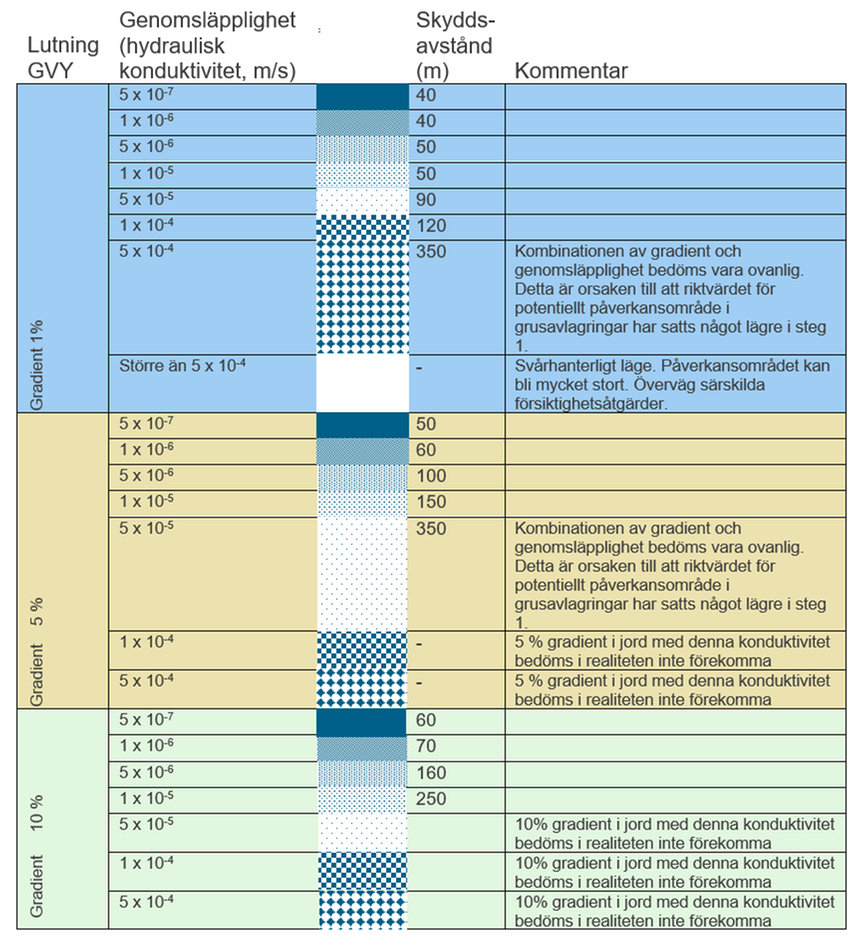
Table 3: Guidelines for minimum protection distances (m) to dug wells when the well is considered to be within the dispersion area of the wastewater facility.
In general, very high permeability, conductivities in the order of 4-5*10-4 m/s, are difficult to deal with in the context of protective distances because the area of influence is very large.
Determination of hydraulic conductivity
In order to be able to assess the transport rate in the soil and thus the protective distance to dug wells, knowledge of the permeability of the soil (hydraulic conductivity) is needed. Hydraulic conductivity can be determined using percolation tests, see section Percolation tests, or other hydraulic tests, such as test pumping in drinking water wells.
In order to make relevant assessments of permeability in the area concerned, i.e. around the wastewater facility and the relevant wells, it is important to consider the hydrogeological conditions at the site as a whole and not uncritically use individual measured values of hydraulic conductivity.
Sieve analysis is usually not sufficient because there are uncertainties in translating information from sieve analysis into hydraulic conductivity. Sampling for hydraulic conductivity testing should be done in the soil layers where transport is fastest (which may vary depending on whether it is situation 3(a) or 3(b), see Tables 2 and 6). Note also that hydraulic conductivity values to be used for the assessment of protection distances according to the simplified method described here must represent the whole zone between the discharge point and the drinking water well. The spatial variation in hydraulic conductivity between the sewerage facility and the well can be significant. This variation is usually a greater uncertainty than that arising from the uncertainties in the analysis and sampling procedure itself.
A general approach when assessing test results can be to start from a “worst case scenario”. However, one needs to reflect on whether any measurement may have been incorrect due to the measurement method/performance and whether a new sample needs to be taken from the same location.
Determination of groundwater surface slope
Determination of the groundwater surface slope (background gradient) can be done by establishing a so-called hydrological triangle, see Determination of groundwater flow direction.
Documentation of how the transportation time has been assessed should be attached to the application. The case officer assesses whether the documentation is sufficient to form the basis for processing the application.
Product details
Article number:
Beslutsmodell för skydd av dricksvatten
No files available.
Irregular fracture networks in the rock and the fact that water abstraction from a drilled well can cause a large drawdown of groundwater means that it cannot be guaranteed that a rock drilled well is protected whether it is higher or lower in the ground than a sewerage facility. However, locating the wastewater facility lower in the terrain than the well is a general guiding principle for both dug and rock drilled wells.
However, statistically, rock drilled wells are more protected from contamination than dug wells (the presence of fecal indicator bacteria is more common in dug wells) (SGU Part 1, 20). Based on general estimates of protective distances based on the modeling SGU has done for drilled wells (including a model with a relatively thin soil layer) and trace experiments, the following protective distances are recommended between ground-based facilities and rock-drilled drinking water wells:
- 30-50 m when the borehole cannot be assumed to be located in the direction of flow of the wastewater-affected groundwater
- 50-100 m when the borehole can be assumed to be located in the flow direction of the wastewater-affected groundwater
- Recommended intervals cannot provide any real guarantees but should be seen as an aid to assessment.
Local conditions in the individual case need to be taken into account when assessing the protective distance needed to the rock drilled well. The assessment of the overall risk picture may determine whether to be closer to the maximum or the minimum distance in the recommended safety distance range. Below is a list of factors that influence the risk of contamination of a rock drilled drinking water well and that are appropriate to take into account in the risk assessment. For a more detailed description click on the link to each risk factor.
Risk factors for drilled wells
Level difference between well and sewer during abstraction
If the groundwater level below the infiltration is lower than the average level in the rock borehole during normal abstraction (Figure 1), there should be no transport from the sewage plant to the rock borehole. However, if the drawdown in the rock borehole is large during normal extraction, there may be a large pressure difference from the infiltration to the rock borehole, which increases the risk of rapid transport and contamination. A period of continuous measurement of the level in the rock borehole (during normal use of the well) is required to get a picture of the average level in the well. Automatic logging equipment can be very helpful.
Figure 1: The groundwater level below the infiltration is lower than the average level in the rock borehole during normal extraction, which means that no transport from the sewage plant to the rock borehole should be possible
Hydraulic conductivity of rock
The ability of rock to transmit water is measured as hydraulic conductivity. If the hydraulic conductivity of the rock is low, i.e. the rock’s ability to let water through is low, there is an increased risk of rapid transport in the cracks. This is because the transport volume in the fractures is often smaller than in rock with higher hydraulic conductivity, i.e. more permeable rock.
Thus, for the same amount of water withdrawal from well X located in rock with low hydraulic conductivity compared to well Y located in rock with high hydraulic conductivity, the transport rate will be higher to well X, because the cracks through which the water will be transported to well X are fewer and smaller.
When water is withdrawn from a drilled well, the drawdown will also be greater if the hydraulic conductivity of the rock is lower. This adds up to an increased risk of contamination if the hydraulic conductivity of the rock is low. Hydraulic conductivity can be evaluated from pumping tests in the well or summarized from SGU
Soil depth
The transport of wastewater through the soil layers forms a barrier before groundwater can form. Increasing the soil depth reduces the risk of contamination of a rock drilled well. A useful support is SGU
Permeability (hydraulic conductivity) of soil layers
Denser soils delay transport down to the bedrock surface more than the more permeable soils and therefore provide a better barrier against contamination of a borehole. In order to assess the rate of transport in the soil and thus adequate protection distances, knowledge of the permeability of the soil (hydraulic conductivity) is needed. Samples of the soil material may need to be taken
However, in order to make relevant assessments of permeability in the area concerned, i.e. around the sewage plant and the relevant wells, it is important to consider the hydrogeological conditions at the site as a whole and not uncritically use individual measured values of hydraulic conductivity. For assessment see section Sieve analysis and percolation test.
Groundwater background gradient in the soil layers
The risk of contamination increases the faster and the closer the contaminated groundwater comes to the rock drilled well. The direction and gradient (slope) of the groundwater in the soil layers thus controls the risk in a similar way as for dug wells. For assessment see Determination of groundwater flow direction.
Groundwater availability
If groundwater availability is limited in the immediate area, it increases the risk that the infiltration water is recirculated to the extraction well because there is not much other water available. If groundwater availability is high, the possibility of further dilution of the infiltration water before it eventually reaches the well increases. An assessment of groundwater availability for small aquifers is presented in SGU’s map viewer Groundwater availability in small aquifers.
Tips on how to assess local geological conditions
As discussed above, the risk of contamination is very much determined by local geological features, but these can often be difficult to determine. However, sometimes the local area can provide valuable information that can be used to assess the risk of contamination. Some examples:
A protruding rock slab between the infiltration and the well can be an advantage as it keeps infiltrated wastewater away from the area near the well, which provides increased safety (Figure 2). In the example, there should be a greater risk of contamination in the well from infiltration B than A if the situation is otherwise equivalent.
Figure 2. Rising rock between sewerage facility and well reduces risk.
If there are rock outcrops in the area, it may be possible to see if there is a dominant fracture direction and use this in the assessment. In the example in Figure 3, visible fractures are shown as black lines. In this case, there should be a greater risk of contamination in the well from infiltration B than A if the situation is otherwise equivalent.
Figure 3: Dominant fracture direction in visible rock outcrops can provide guidance on the placement of drains that poses the least risk of contamination. The risk of contamination in the well from infiltration B is greater than A if the situation is otherwise equivalent.
Local ridges and valleys may indicate that there are more or larger rock fractures in a particular direction. Figure 4 shows some ridges that may indicate that the underlying rock has more or larger fractures from left to right (rather than top to bottom). There should then be a greater risk of contamination in the well from infiltration A than B if the situation is otherwise equivalent.
Figure 4. Some guidance on the fractured nature of the rock can be provided by ridges in the immediate area. The ridges indicate a higher probability of larger fractures in the bedrock in the same direction (from left to right, rather than top to bottom). There should then be a greater risk of contamination in the well from infiltration A than B if the situation is otherwise similar.
Examples of safety distance assessment for drilled wells
Figure 5-7 illustrates three examples with gradually deteriorating conditions. A reasonable safety distance assessment for these three cases could be
– 30-40 m for Figure 5, rock drilled well with few risk factors.
– 40-60 m for Figure 6, rock drilled well balancing in a position between high and low risk.
– 80-100 m for Figure 7, rock drilled well with many risk factors.
Figure 5. Rock drilled well with few risk factors. The well is clearly higher in the terrain in relation to the sewer. The level difference between the well and the groundwater beneath the sewer is in the right direction and reassuring. The conductivity of the rock is high (larger fractures and good inflow into the well). Soil depth and groundwater availability are adequate. A reasonable protection distance assessment for this case could be 30-40 m.
Figure 6. Rock drilled well in a location that balances between high and low risk. The well is not clearly in the flow direction of the wastewater. The difference in level between the well and the groundwater below the sewer is insignificant. The hydraulic conductivity of the rock is somewhere between low and high (greater fracturing and good inflow into the well). There is some soil depth and groundwater availability is neither small nor large. A reasonable protection distance assessment for this case could be 40-60 m.
Figure 7. Rock drilled well with many risk factors. The well is located in the direction of wastewater flow, the soil depth is poor, the level differences between the well and the groundwater below the sewage plant are large and the opposite of what is desirable. The conductivity of the rock is low (limited fracturing and poor inflow into the well) and groundwater availability in the soil layers is sparse. A reasonable protection distance assessment for this case could be 80-100 m.
Part B Protective distances to dug wells
For dug wells, an assessment can be done in steps (Figure 8). First, a general assessment is made of whether there is a risk of impact on the drinking water source based on soil type and distance (impact area). If the drinking water source is located within the area of influence and in the direction of groundwater flow (dispersion area), an assessment of protective distances must be made that carefully ensures that the requirement of 2-3 months transportation time is met.
Even in cases where the drinking water source is located outside the dispersal area, an assessment of protective distances needs to be carried out because there is a risk that a water withdrawal will change the direction of flow so that it goes from the wastewater facility towards the drinking water well (sink funnel). The steps that need to be included in the assessment depend on the location of the wastewater facility in relation to nearby wells (Figure 8).
Step 1 -> Step 2-> Step 3
Figure 8. Overview of decision model for dug well protection. Red, dashed line = no. Green line = yes. The image should be read from left to right.
Step 1: Are there drinking water wells within the potential impact area?
It can normally be considered that there is no risk of impact on wells with drinking water abstraction for one or a few households if there are no wells within 150 meters of the effluent discharge in sand, till or fine-grained soils and within 300 meters in gravel deposits, see Table 1.
Table 4: Guideline values for the potential impact area from infiltration sewage facilities. Values are mainly based on Blaschke et al (Blaschke, et al., 2016)
Normal case does not include areas with very thin soil layers. Potential impact area is mainly based on Blaschke, et al., (2016).
If the discharge occurs in highly conductive gravel (k-value > 4 x 10⁻⁴ m/s), it is not possible to estimate a reasonable potential impact distance from the wastewater facility as long as it is within the same groundwater body. However, it is uncommon for gravel with such properties to be widespread (Blaschke, et al., 2016).
Figure 9. Well (red dot) outside the potential impact area requires only step 1, as long as the soil type consists of gravel deposits, sand, till and similar with a hydraulic conductivity lower than 4 x 10⁻⁴ m/s. See also Table 1.
If the distance to the drinking water source is further than the guidance value for the potential impact area, see Table 1 and Figure 9, no further investigation of the risk of impact on the well is required. If there are wells closer to the site than the proposed guidance values, it is important to be able to reliably assess the direction of groundwater flow, see step 2.
Step 2: Is there a well within the dispersal area?
Step 2 aims to determine whether the drinking water well is located within the dispersion zone (gray zone, Figure 10), i.e. in the natural flow direction of the groundwater. Determining the flow direction may sometimes require hydrogeological field measurements, see section Assessment of the natural groundwater flow direction and background gradient.
The size (angle) of the dispersion area can vary depending, among other things, on the slope of the water table. A large slope results in a smaller dispersion area than a small slope. An assessment must be made in each individual case.
Figure 10. The figure shows an example of a well (red dot) that is found after investigations to be outside the dispersion area (gray zone) even though it is within the potential impact area of Step 1 (in this example within 300 m in gravel with hydraulic conductivity lower than 4 x 10⁻⁴ m/s). The location requires a Step 3a assessment.
Figure 11. The figure shows an example of a well (red dot) that, after investigations, is found to be within both the dispersal area (gray zone) and the potential impact area (in this example, within 300 m in gravel with hydraulic conductivity lower than 4 x 10⁻⁴ m/s). The location requires a Step 3(b) assessment.
If the drinking water well is located outside the dispersion area, see Figure 10, an assessment of the protective distance still needs to be made. The purpose of the assessment is to rule out the risk of impact due to a change in the direction of groundwater flow during water abstraction, known as a sink funnel, see step 3a.
If the drinking water well is found to be within the dispersion area, see Figure 11, an assessment needs to be made of whether the transport time of the wastewater-impacted groundwater to the drinking water well is at least 2-3 months. The transport time is affected by the current soil and groundwater conditions, see step 3b.
Assessment of natural groundwater flow direction and background gradient
Usually, flow direction is roughly assessed based on the topography of the site combined with rock mapping (review of visible rock features). Rock outcrops can generally be considered as watersheds that direct the water flow in some direction.
Especially in permeable soils, it may be necessary to assume that the well is within the dispersal zone (gray zone) and proceed to assess whether 2-3 months transport time can be guaranteed, step 3b. Examples of areas with difficult to assess flow direction are flat terrain or areas with coarse textured soils (especially pebble ridges) where a flow direction that follows the topography cannot be expected.
In groundwater bodies mapped by SGU, it is common that the flow direction has already been determined. The information is available in SGU’s map services (map viewer Groundwater bodies) and/or in the in-depth descriptions that can be downloaded or ordered through Geolagret. However, it is important to check the applicability of the information to the individual case. SGU’s groundwater mapping has been carried out at several different scales over the years. The methods for determining flow direction vary between these scales.
Where there is uncertainty about the direction of groundwater flow, hydrogeological field measurements may be required. The applicant, or an expert engaged by the applicant, may make field measurements of flow directions by balancing levels. The measurement is made by establishing a so-called hydrological triangle, see Determination of groundwater flow direction. At the same time, it is possible to determine the slope (gradient) of the groundwater surface, which can also affect the risk of a drinking water well.
If no hydrogeological field measurements are carried out, moist areas, level measurements in nearby wells, groundwater discharge in trenches, etc. can provide general support for assessing the position of the groundwater surface and thus also provide a basis for estimating the gradient.
Documentation in the application
The documentation of how the assessment of the groundwater flow direction has taken place should be attached to the application. The case officer assesses whether the documentation is sufficient to form the basis for processing the application.
Step 3: Are distance requirements to wells met?
Step 3 aims to determine whether the proposed location of the wastewater facility is safe in relation to a dug drinking water well. There are two options, a and b, depending on the location of the drinking water well:
3a When the drinking water well is outside the dispersion area (outside the gray zone)
This is a protective distance due to the risk of water abstraction changing the direction of flow from the sewage treatment plant towards the drinking water well (sink funnel). The protective distance refers to the distance to the facility as well as the distance to the dispersal area (gray zone). See figure 10.
3b When the drinking water well is within the dispersal area (inside the gray zone)
Here it is a question of ensuring that the protective distance from the wastewater discharge to the drinking water well is sufficient. See figure 11.
3a When the drinking water well is outside the dispersion area (outside the gray zone)
If the drinking water source is within the impact area but outside the dispersion area, the risk of a water withdrawal changing the direction of flow so that it goes from the sewage plant towards the drinking water well (sink funnel) needs to be investigated, see Figure 12.
Figure 12. Water abstraction and sewerage facilities can change the direction of groundwater flow. The illustration shows how withdrawing water from a well and adding water from infiltration can change the direction of groundwater flow.
In this case, guidelines for minimum protection distances are given in Table 2. The protection distance applies to the distance to the installation as well as the distance to the dispersal area of the installation (gray zone).
To assess protective distances, knowledge of the permeability of the soil between the well and the discharge point of the wastewater facility and the groundwater gradient is needed, see Determination of hydraulic conductivity. A protective distance of 40 m is generally sufficient regardless of the soil, provided that this distance is maintained to both the well and the discharge point, see Figure 13. However, this does not apply to drinking water wells in permeable soil and flat terrain, see section below.
Table 2: Guidelines for minimum protection distances (m) to dug wells when the well is considered to be outside the defined dispersal area (gray zone) of the wastewater facility but within the potential impact area. The protection distance applies to the distance to the plant as well as the distance to the plant’s dispersion area (gray zone). The table is based on the natural slope of the groundwater surface (background gradient) in combination with the permeability of the aquifer. Note that denser soils require larger protection distances. The grid in the third column from the left illustrates soil permeability.
Figure 13. Well (red dot) is outside the dispersal area (gray zone) and more than 40 m from both the sewerage facility and the dispersal area. In this situation, a protective distance of 40 m is generally sufficient regardless of the soil, provided that this distance is maintained to both the well and the dispersal area, with the exception of drinking water wells in permeable soil and flat terrain, see Table 2.
Less permeable soil means longer protection distances
Table 2 shows that a low permeability (low hydraulic conductivity) results in longer protection distances than if the soil is more permeable. If the permeability is low, there is an increased risk of impact on the well. The explanation for this is that groundwater levels in the low conductivity soil are more affected by both water abstraction from the well and water supply at the sewage treatment plant. The low conductivity soil has a low porosity. This forces large changes in the level of the soil when those pores are supplied with water or drained of water. Thus, the risk of reversing the groundwater flow so that the well absorbs wastewater is higher in the low conductive soil than in the high conductive soil.
Drinking water wells in permeable soil and flat terrain are a hazardous situation
If the dug well is in permeable material in flat terrain where it is uncertain in which direction the groundwater surface is inclined, the well is in a hazardous situation. Table 2 refers to Table 3 for these situations.
As the gradient can be difficult to determine and can also vary over time, there is a danger in assuming zero gradient in permeable (highly conductive) soils. The well could then be located both inside and outside the dispersion area of the wastewater facility (gray zone). One must then assume the most hazardous situation and assume that it will be able to be located within the dispersion area of the wastewater facility.
3b When the drinking water well is in the dispersal area (inside the gray zone)
If the determined flow direction means that the drinking water well is in the dispersal area of the wastewater facility, it must be carefully ensured that the requirement of 2-3 months transport time is met. This places higher demands on the documentation from the applicant. Reliable information is required regarding
drinking water well design
groundwater surface slope
distribution of soils between well and sewerage facility
soil water permeability (hydraulic conductivity).
As a rule, most of the required information can be obtained by sampling and investigation in test pits.
An assessment of protection distances can be made based on the site-specific information on the slope of the water table and the permeability of the soil in the direction of flow of the effluent, see Determination of hydraulic conductivity and Determination of the slope of the water table. Table 3 can be used to support the assessment. Table 3 shows protective distances for dug wells and has been calculated using a simplified hydraulic calculation model (SGU part 1, 2023).
Table 3: Guidelines for minimum protection distances (m) to dug wells when the well is considered to be within the dispersion area of the wastewater facility. The table is based on the slope of the groundwater surface (background gradient) in combination with the permeability of the aquifer. The grid in the third column from the left illustrates the permeability of the soil.
Table 3: Guidelines for minimum protection distances (m) to dug wells when the well is considered to be within the dispersion area of the wastewater facility.
In general, very high permeability, conductivities in the order of 4-5*10-4 m/s, are difficult to deal with in the context of protective distances because the area of influence is very large.
Determination of hydraulic conductivity
In order to be able to assess the transport rate in the soil and thus the protective distance to dug wells, knowledge of the permeability of the soil (hydraulic conductivity) is needed. Hydraulic conductivity can be determined using percolation tests, see section Percolation tests, or other hydraulic tests, such as test pumping in drinking water wells.
In order to make relevant assessments of permeability in the area concerned, i.e. around the wastewater facility and the relevant wells, it is important to consider the hydrogeological conditions at the site as a whole and not uncritically use individual measured values of hydraulic conductivity.
Sieve analysis is usually not sufficient because there are uncertainties in translating information from sieve analysis into hydraulic conductivity. Sampling for hydraulic conductivity testing should be done in the soil layers where transport is fastest (which may vary depending on whether it is situation 3(a) or 3(b), see Tables 2 and 6). Note also that hydraulic conductivity values to be used for the assessment of protection distances according to the simplified method described here must represent the whole zone between the discharge point and the drinking water well. The spatial variation in hydraulic conductivity between the sewerage facility and the well can be significant. This variation is usually a greater uncertainty than that arising from the uncertainties in the analysis and sampling procedure itself.
A general approach when assessing test results can be to start from a “worst case scenario”. However, one needs to reflect on whether any measurement may have been incorrect due to the measurement method/performance and whether a new sample needs to be taken from the same location.
Determination of groundwater surface slope
Determination of the groundwater surface slope (background gradient) can be done by establishing a so-called hydrological triangle, see Determination of groundwater flow direction.
Documentation of how the transportation time has been assessed should be attached to the application. The case officer assesses whether the documentation is sufficient to form the basis for processing the application.
Article number:
Beslutsmodell för skydd av dricksvatten
No files available.