


Your cart is currently empty!
Wastewater flows from households with individual sewers and compact treatment technologies
The new report shows much lower flows, 99 l/p/d than the current 170 l/p/d in the Swedish Agency for Marine and Water Management’s general advice.
This study was commissioned by the Swedish Agency for Marine and Water Management
The content of the report does not imply any position on the part of the Agency.
The starting point was that the standard value for wastewater flows to individual sewage plants, which is set at 170 l/p/d in the Swedish Agency for Marine and Water Management’s general advice on small sewage plants for domestic wastewater, may be too high, given current conditions.
There are clear indications that domestic water use in Sweden has been reduced, which should also be reflected in the inflow to individual wastewater facilities.
The study was conducted at Luleå University of Technology by the authors of this report, in collaboration with BAGA Water Technology AB, Biovac Sverige AB, Watersystems Sverige AB and Uponor Infra AB
It is currently not sufficiently known how large wastewater flows are supplied to individual wastewater facilities. The wastewater volumes specified in HVMFS 2016:17 for calculating specific quantities and concentrations in wastewater, 170 (150-200) l/p/d (HVMFS, 2016), have been deemed by many bodies to be too high.
Water use in Swedish households is generally decreasing, as pointed out, for example, in a report by Statistics Sweden on water use in Sweden in 2015 (SCB, 2017). The reduction is probably mainly due to increased use of low-flush toilets and fittings (SCB, 2017).
Already in a study from 1998 it was observed that the average flow to soil beds was lower than 170 l/p/d, namely 120 l/p/d (Nilsson, Nyberg et al., 1998). In Swedish Water’s new publication P114 a median value for specific water consumption of 136 l/p/d was presented (Swedish Water, 2020).
Wastewater volumes according to HVMFS 2016:17 are used to standardize pollutant concentrations and the treatment efficiency (in %) of a wastewater facility.
Thus, once a pollutant concentration in the effluent is measured by sampling, the percentage treatment efficiency can be calculated and its adequacy assessed. If too high values are assumed for wastewater flows, there is a risk that the percentage treatment efficiency is underestimated.
Therefore, it is important that the wastewater flow is estimated as accurately as possible.
The aim of this study was to investigate the current wastewater flows to individual sewage treatment plants using measurement data from individual sewage treatment plant suppliers.
2.1 Approach
Four mini treatment plant suppliers were contacted and asked to provide information on the wastewater facilities they monitor in terms of type of facility, pump cycles logged over time, property name and address.
The calculated wastewater flows were then compared with drinking water consumption flows measured in Swedish households connected to the municipal drinking water network (Svenskt Vatten, 2020).
Although there is potentially some influent flow in individual wastewater treatment plants, this flow was assessed to be significantly less than that supplied to municipal wastewater treatment plants with large pipe networks.
2.2 Data collection
Four producers of mini-wastewater treatment plants provided information on wastewater flows in a sample of delivered operational plants. In total, data were obtained from 460 plants, 122 of which were rejected because it was not possible to obtain information on the number of residents on the property, which is indispensable information for calculating the wastewater flow per person.
A complete data set (flows and number of residents) was thus compiled for 338 plants, of which 223 were from BAGA Water Technology AB, 66 plants from Biovac Sverige AB, 28 plants from Watersystems Sverige AB and 21 plants from Uponor Infra AB.
The majority of these sites (320 sites) were sized for 5 pe while a smaller number (18 sites were larger with up to 19 people connected).
In total, pump data from 198,620 measurement days (corresponding to 544 years) were evaluated, covering a total of 338 pumps in different wastewater facilities. The average measurement period per pump amounted to 588 days.
2.3 Data evaluation taking into account very high or low wastewater flows
As very low or high wastewater flows are unlikely to reflect realistic conditions (full-time living etc.), measured pump flows were also evaluated with these values excluded.
Thus, the very low and high flows were not completely excluded from the study (they are presented in Table 2 and Figure 2) but the data set was evaluated even without these flows. Unreasonably low was defined here as flows below 50 l/p/d.
Water consumption below 50 l/p/d can therefore be considered unlikely; in cases where water consumption has been lower
, other reasons may be at play, such as absence of the facility’s users due to vacations, part-time residence or similar.
Leakage in individual sewer systems is a common occurrence and cannot be generally excluded in the evaluation. However, values higher than 230 l/p/d were considered to be unreasonable and may have been caused, for example, by incorrect information on the number of occupants or by downpipes from roof drainage or backwash water from water softening steps being connected to the system.
3 RESULTS
For each plant type, both mean and median flows were calculated. These varied considerably between some of the different plant types. The standard deviation is also high for all plant types, indicating a large variability in measured flows.
BAGA Water Technology Pump flow, mean 114 ± 85 and Pump flow, median 94 (l/p,d)
Biovac Sverige AB Pump flow, mean158 ± 125 and Pump flow, median126 (l/p,d)
Watersystems Sverige AB Pump flow, mean 75 ± 24 and Pump flow, median72( l/p,d)
Uponor Infra AB Pump flow, mean89 ± 45 and Pump flow, median77 (l/p,d)
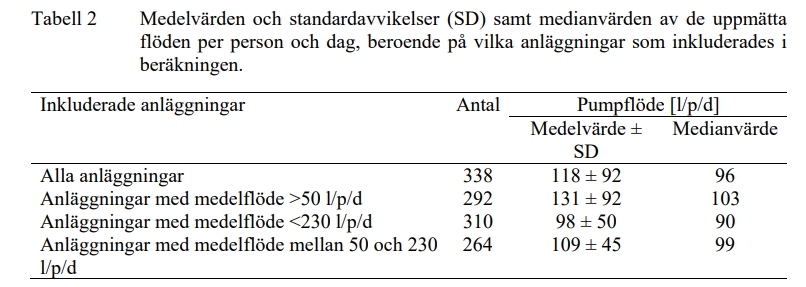
All plants in the study Pump flow, mean 118 ± 92 and Pump flow, median 96 (l/p,d)
Plants with mean flow between 50 and 230, the median value is 99 l/p,d to be compared to the daily norm of 170 l/p,d
When it comes to the wastewater flow to a plant, the amount of time users spend at home is probably the most important factor, while their age may be less important. However, it is difficult to take this into account when assessing a facility.
However, it may make sense to take into account the number of occupants and use a less specific wastewater flow when the number of occupants
is high.
4.3 Reassessing the pollution reduction of a facility using effluent concentrations
When too high a default value for the waste water flow is used to calculate the treatment efficiency of a facility, there is a risk that a facility is unnecessarily condemned. This is because a relatively low concentration needs to be achieved in the outgoing water in order for the plant to be said to meet the requirements for treatment efficiency.
As an example, this has been calculated for phosphorus in Table 3.
When the flow template is at 170 l/p/d, the incoming phosphorus concentration to the treatment plant can be assumed to be 12 mg/l and the outgoing concentration is required to be at a maximum of 1 or 3 mg/l, depending on the protection level.
When the wastewater flow is smaller, for example within the quartile distance determined in this study, the effluent concentration would need to be at most between 1 and 8 mg/l, depending on the protection level and on the flow assumed (Table 3).
5 CONCLUSIONS
In this study, a mean flow to a wastewater facility was determined to be 99 l/p/d as the median value and 109 l/p/d as the mean value, with a standard deviation of 45 l/p/d. 50% of the measured values were in the range 75-130 l/p/d (quartile range).
These developed flows are relatively low, even in comparison with the flow range for drinking water consumption specified in Swedish Water
P114, 120-150 l/p/d, and the standard flow specified in HVMFS 2016:17, 170 (150-200) l/p/d.
The dataset produced showed a large variability. Possible causes are inflow of additional water, as well as factors such as number of residents, age, income level and temperature during the measurement period.
The study showed that the determined specific flow was negatively correlated with the number of residents connected to the wastewater facility (Pearson coefficient = -0.41, p = 0.000), i.e. the specific flow decreased with increasing number of residents.
This relationship had already been shown by Swedish Water for domestic consumption of drinking water.
Perhaps this phenomenon could be taken into account when choosing a default value for the wastewater flow when assessing a wastewater facility.
For example, a plant’s load could be determined using flow data from the supplier instead of using the standardized load.